Our school was having visitors that week, and I needed a show-off problem in case they dropped by my room. The circle square problem caught my interest. As posted by Dan Meyer,
Given an arbitrary point P on a line segment AB, let AP form the perimeter of a square and PB form the circumference of a circle. Find P such that the area of the square and circle are equal.
The math behind this problem was perfect. I was in the middle of systems and just been through transformations with my algebra II/trig classes. The math was a bit challenging for A2/Trig, but it would yield so much insight into the math they were working on. Then I figured my pre-calc classes would have fun with it, and I’d get more insight into the lesson if I ran through it more than once. So I did the same problem for all my classes that day, but with a different approach.
But what problem? I decided to show my students both the abstract, general version of the problem, and the one I’d doctored up to make more accessible. In my A2/Trig class, I showed the abstract form first; in precalc, the doctored one first. All my students saw both problems and given the opportunity (which most took) to recognize the difference.
Lesson objectives:
- Give students an insight into the general case, by comparing it to an applied case.
- Gain a deeper understanding into geometric relationships.
- Understand that “systems of equations” were more than just two lines (A2/Trig).
- Improve modeling skills, “making math out of words”.
- Gain a deeper understanding of transformations (A2/Trig) as well as the link between graphic and algebraic representations.
- Solve the problem and understand what the solution means.
I read through all the comments and links in the original blog post, finding two of them extremely helpful in formulating my thoughts. First, Dan Anderson’s work on Desmos was invaluable, not because I understood the sliders (I don’t) but because I hadn’t considered the problem in terms of function transformations until I saw his work, even though he didn’t address it directly. Then I found this essay by Tim Erickson to be the most helpful as a framework for considering the problem, even though I didn’t use any of his suggested approaches. He also provided me with the observation I used to close the lesson (and hadn’t thought of on my own). I wouldn’t even know how to solve this using calculus. I combined Erickson’s Queen idea with the cowboy ranch thing mentioned here and came up with the Empress of China and pandas.

You’re thinking oh, god, a cutesy problem. Well, yes, but it’s an ironic cutesy! Plus, come on, the pandas are adorable.
Whenever I’m doing a complicated project for the first time, I overwrite the handout. That way if I forget something before the release I can point the kids to text. So the Algebra II/Trig handout goes into considerable detail because it’s covering the actual lecture. I was also moving a little more slowly with the A2 kids, as I wanted them to understand the process of understanding an abstraction. I made my teaching literally visible to help them see what they, too, could do to unlock a difficult problem.
By contrast, in the PreCalc class, I tossed them in with only one hint: there were three equations.
I wanted a manipulative, both to literally help kids make concrete sense of the problem, but also to demonstrate what manipulatives do. It’s just a line. It’s just the word “webbing”. But now, look. It’s the actual thing. See how this thing, even if you don’t really use it, clarifies the next step?
So I needed some gold webbing, and it can’t be a coincidence that I settled on paper clips. (The big question is why didn’t Dan Meyer think of it?)
I wanted something I could reuse, and that the kids could reuse, unclipping the chain for one test and then putting it together again, creating several different versions if needede. In truth, I didn’t think they’d use the manipulatives much, but the idea of them, as well as one walkthrough, would probably get the more concrete thinkers moving. Plus, the kids got a kick out of the chains.
I spent $4 in paper clips, which would have only been $3, but I kept losing track of how many I’d chained together, so I went back to the dollar store and bought some colored clips to use every 20th clip. I did one at school for proof of concept, then went home and did five more while watching TV. Which probably wasn’t a good idea, because the couch ate several chains before I got wise and put them on the floor.

Then I had to figure out how to bring them back into school without getting them all snagged. A bamboo skewer worked as a rod and the tiny ponytail bands that can’t handle my hair kept them from sliding around.
Intro to the problem in both cases took no more than ten minutes; the kids were up and working by 15 minutes in. I have whiteboards all around the room, so the kids are up sketching and thinking in groups of 4.
I wish I’d captured the Algebra II/Trig work, but I forgot. Several of these groups actually read my handout, and selected 60-40 as their first modeling scenario. The precalc kids had the same suggestion, but everyone jumped right to 50-50. It didn’t make any difference, but I would have liked to have shown the different thought processes.

All the kids unclipped the chains, made squares or circles on desks or with hands and giggles and quickly grasped the algorithm for moving from perimeter to area of a square. To my pleased surprise, all but a couple groups also uncovered the process from circumference to area of a circle. Those who didn’t had the first step down, but were hung up on dividing by pi. I told them to get over it; they’d be taking the square root of pi before they were through.
When all the groups had identified the three equations needed, I stopped and went to Desmos.

This is a recreation of the conversation as it went in A2/T; the precalc conversations were the same except transformations (we haven’t covered those yet).
[See note at bottom]
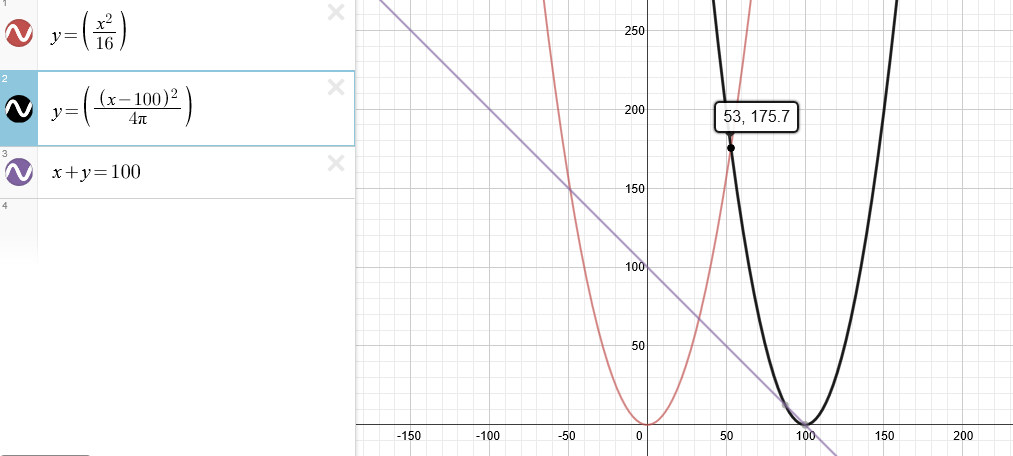
“So before we go on to treat these equations as a system, let’s consider each equation. The graph above shows all three of the equations, without treating them as a system. Mandy, what do you see?”
“Um. Two parabolas, and one line?”
“Fair enough. Now, everyone look at the graphs and think of transformations: vertical shifts, horizontal shifts, stretches, compressions. You have your parent graph notes. Take a look at the parent graphs for lines and quadratics.”
Serge: “Hey, I see. So the quadratics are stretched.”
“Vertically or horizontally?”
“Horizontal,” says Dani. “The denominator changed and got bigger, from 1 to 16.”
“Good. What about the line?”
Shane: “It’s reflected over the x-axis, and shifted….vertically? Up?”
“Or horizontal to the right.”
“Good! So now, back to the stretch. Are they stretched the same amount?”
“No.” Judy. “The…which one is red, the circle? No, the square. The square is stretched…less, vertically. It’s going up slower.”
“Very nice. What’s that mean, Julian?”
“I don’t know.”
“Oh, stop. Think. Take a look at the equations, everyone. Right now, we’re using x in both, right? So the graphs show what happen to each if we cut the webbing exactly in half. If we look at our equations, we take the perimeter, square it, and take one-sixteenth of that value, right?”
“We divide it by sixteen,” said Ann. “Oh, that’s the same thing.”
“So what do we do with the circumference? Remember, what’s pi again?”
“3.14.”
“So if I multiply that by 4, I get around…”
“Twelve.”
“Right. So if I start with equal values and square them, which is going to be larger? The one I divide by 16, or by 12? I’m taking a sixteenth of one squared perimeter, and a twelfth of the other. Which is bigger?”
Pause. “Come on, think. I divide a number by 16, or I divide it by 12.”
Ah, now they get it. “Twelve!”
“So what does this mean? How can we use this knowledge? What does it mean about the relationship of perimeter to area?”
Pause again.
“So if I have a circle and square with the same perimeter, which shape will have the bigger area?”
“Circle.” This they’re sure of.
“Okay. So let’s think about our task at hand. We need to make our areas equal. What does that tell us about their perimeters?”
Now they get it, and I hear the knowledge in their voices as they talk over another. The square has to have the larger perimeter. That means it has to have the bigger piece of the chain.
And then I send them off to solve the algebra. I remembered to capture pre-calc work—in a few cases there are errors that I later corrected.


If I were half as orderly as this student, I wouldn’t ever lose my glasses, car keys, or Promethean pen. Except–alas–they’d made a mistake on the first attempt. I pointed it out, they went back and fixed it, but I forgot to take another picture.

I gave a fair amount of algebra assistance in the A2 class. For the pre-calc kids, I just said “Don’t distribute. Ever. Get a calculator when you realize you need a co-efficient.” From that, most of them called me over to confirm that they were ready to use the calculator. I corrected algebra and encouraged, but the kids weren’t sitting around passively. Active working and thinking the whole time..
In A2/Trig, I ensured everyone started by solving the linear equation for C, then solving the entire equation for P (the perimeter). In Precalc a number of groups figured out the substitution before I got there, solving the line for P and the entire equation for C.
Once everyone had solved for P or C, or I’d talked them through it in a few cases, back to Desmos.
“We looked at the three graphs. Now let’s consider it as a system.”
In all cases, the classes literally gasped. Some context—most of my kids don’t have graphing calculators. Many students had just realized now, for the first time, that “solving graphically” meant something other than graphing two lines manually and finding the point of intersection, that it meant saving a hell of a lot of time and algebra.
Did I point this out? No. I missed it. Only yesterday, when typing this up, did I suddenly flash back to the gasps and realize what they meant. Arggggghh. I don’t think graphing calculators and solutions should make an appearance until the algebra is beyond the kids’ abilities, because most of my kids need strong algebra skills far more than they need advanced math analysis. But I still should have made the point.
For homework, the pre-calc kids had to take a whack at the abstract version; the A2/T kids had to answer some questions.
The next day, I closed the lesson out first by restating the objectives. Systems come in all forms. Transformations can help us make sense of relationships.
And then, the geometry, which the kids clearly found fascinating. In each class, I pointed out that circles are more efficient at closing space than squares are, and before I could ask the question, students—many of them strugglers—pointed out that squares could be grouped more efficiently. Even better, several strong students pointed out that we could probably calculate the difference between the individual square’s “lost” area and the space you always see between four circles. (And yes, that’s going to another fun problem in the future!)
Finally, the perplexing reality: giving Ping and Sing their own private space lost them a huge amount of space! If they’d left it as one big piece of webbing, the two would have had a palace.

“You’d think the carpenters could just make one big circle and give Sing a bunch of picture frames or something.”
At the various blogs I read, many math teachers sniffed at the idea of turning this into simple problem-solving. Well, I like problem solving; I want my kids to be strong at the algebra and modeling necessary to solve this problem. But I also found many links to important concepts through the simple “problem solving”. This activity provides connections a seemingly simple problem, which they grasp, to transformations, systems, and geometric figures, which they often just treat as “things to be learned to survive math class”.
From idea to execution was just over 24 hours elapsed. Actual time spent building the lesson, about 6 hours—3 of them on paper clips. Next time, I’ll do it later in the year for A2/Trig, and haven’t yet decided when to do it for Pre-Calc. The handouts need some tweaking, and I need to start working more graphing calculator work into my pre-calc classes. Definitely a keeper. Thanks, everyone, for the mind food.
[Note: Dan Meyer pointed out something in the comments that led me to re-write this slightly. I didn’t make it clear in the first write up that the first graph display was of the three equations–NOT a system. I added what I actually said in class, that these equations assumed that the two strands were equal. The purpose here was to show the kids why, in fact, the areas would NOT be equal if the strands were. I did cover that in all three classes, and completely forgot to write it up, since I was focused on the transformation aspect.
The second point Dan raises, that the line is not using the same data is a good point. I was focusing on showing the equations together, but the x and y aren’t the same and in the second image, that’s not correct. I’ll do it differently next time.]

Sweet! Great report, I’m jealous!
Meanwhile, I’m always torn about stretching parabolas. I mean, consider y = (x/4)^2. Is that a horizontal stretch, while y = x^2/16 is a vertical stretch? And if so, does it really matter? I don’t know.
I also love it that you used paper clips. I used twine, and though it was continuous, the squares were seriously lumpy.
Thanks for the kind words. It’s funny you should mention stretch/compressions. I’ve always had a tough time understanding it myself, much less teaching it. I usually keep it very simple, just teaching vertical stretch/compression. But I had an insight while working with a student and did a much better job explaining it in the context of linear equations than I ever have before.
Basically, slope is rise over run. So if you change “rise”, it’s vertical. If you change “run” it’s horizontal. So if I “compress” the horizontal, then the slope is moving through x more slowly, the “run” is less. That means the ratio of rise to run is more, so slope is steeper. If I “stretch” the horizontal, then the slope is moving through x more quickly, making the “run” greater, reducing the rate of rise to run, slope is less steep. So “stretching” the vertical is the same as “compressing” the horizontal, and so on.
Using this method, I could explain how to do multiple changes. So for example, if you have one of those purchasing decision questions (adult tickets $8, child tickets $3, bought $48 of tickets), you could ask how the slope is transformed if adult prices were increased by 20% and child decreased by 33%.
I saw a much better understanding of it. And of course, parabola’s “a” value is the same concept.
I was going to write it up; it was really a breakthrough in explanations for me.
Here’s the boardwork:
Thanks for writing up your approach here, Michele. It hadn’t occurred to me to use this task as a site for transformations.
If I understand this correctly, you’re using the first Desmos image you linked to (the one with the first two equations parametrized for x) to get at transformations. It seems to do that nicely, emphasizing the different coefficients of x^2.
But those equations imply that the circumference of the circle and the perimeter of the square are both equal (they’re both x) where the answer to the original question requires them to be different. And x + y = 100 in this instance seems to have us adding a length (x) to an area (y).
I’m not generally one to spend a comment digging into imprecisions in the math but your students seem to have made an interesting transition here that I’d like to understand better.
PS. “I remember reading about you.” Nice to see you sharing some of the pedagogy you’ve been developing since you became a cause celebre. I’ll be checking back in.
Yes, this is a failure of the writeup but I did cover it in the lesson. In the lesson, I said okay, now let’s consider these three equations as separate functions. That is, before we turn them into systems. So in this case, it’s as if we cut the webbing [wait for answer, students get it] in half.
Then, in the second–and I do say this–we consider it as a system, in which the x’s are dependent on each other.
The line issue is different, and I actually covered this again in my talk, but didn’t make it clear in the writeup. I wanted them to see the line, but we discussed that we aren’t using the same output. Hard to do. Next time, I think I’d skip the line.
But the quadratics, I did make it clear. I often have my kids think about the individual equations before they start to solve them as systems, to think about how each of them behaves, and what that tells us about the underlying problems.
I’ll update the text to include what I said, with a link to your comment.
This isn’t the first idea I got from your blog: https://hypersensitivecranky.wordpress.com/2013/10/25/halloween-candy/
But that lesson was for an Algebra II class, which is more like an advanced algebra I class.